Nx Cloud tracks CPU and memory usage for each task in your CI pipeline. Use this data to find resource bottlenecks, debug out-of-memory errors, and pick the right agent size for your workload.
Resource Usage with Nx Agents
Section titled “Resource Usage with Nx Agents”With Nx Agents, resource metrics are collected automatically. You can view this data in the Nx Cloud dashboard for any CI pipeline execution.
Viewing the Analysis Summary
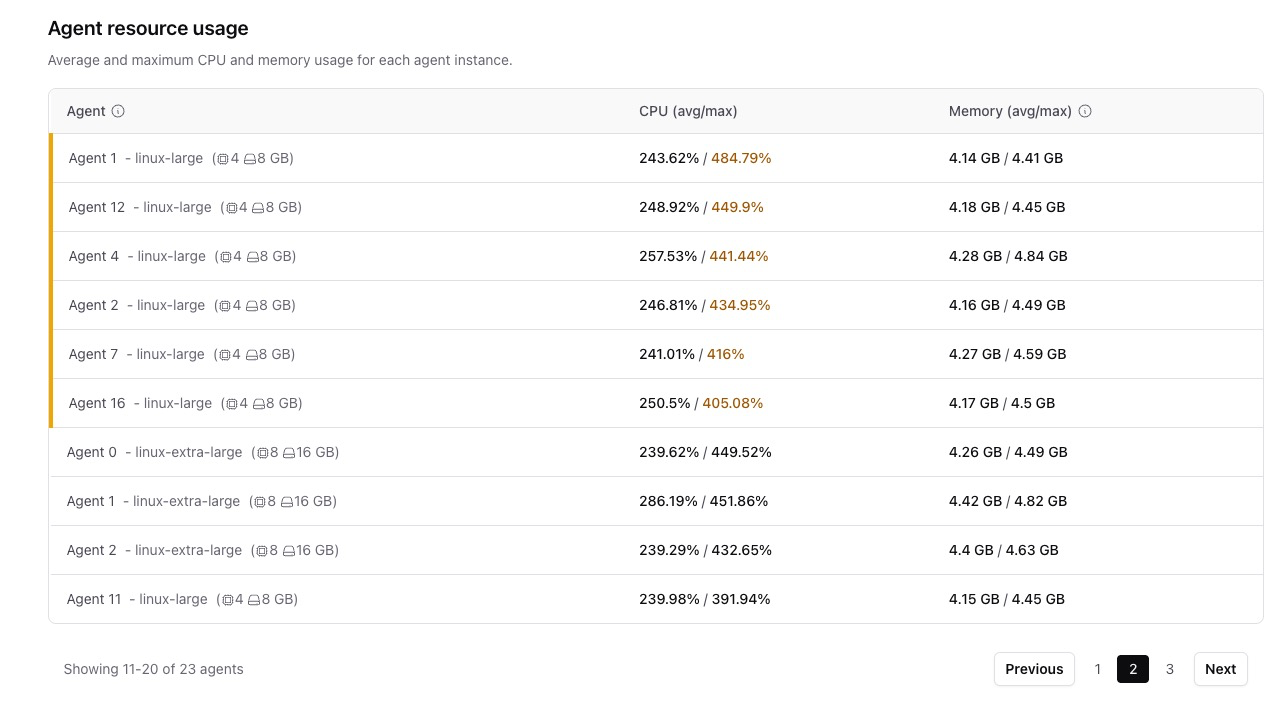
Section titled “Viewing the Analysis Summary”Open any CI pipeline execution in Nx Cloud and go to the analysis section. You'll see a list of agents used for the run, along with:
- Average and maximum CPU usage
- Average and maximum memory usage
- Machine specs for that resource class
This gives you a quick look at how resources were used across all agents.
Viewing Usage Details
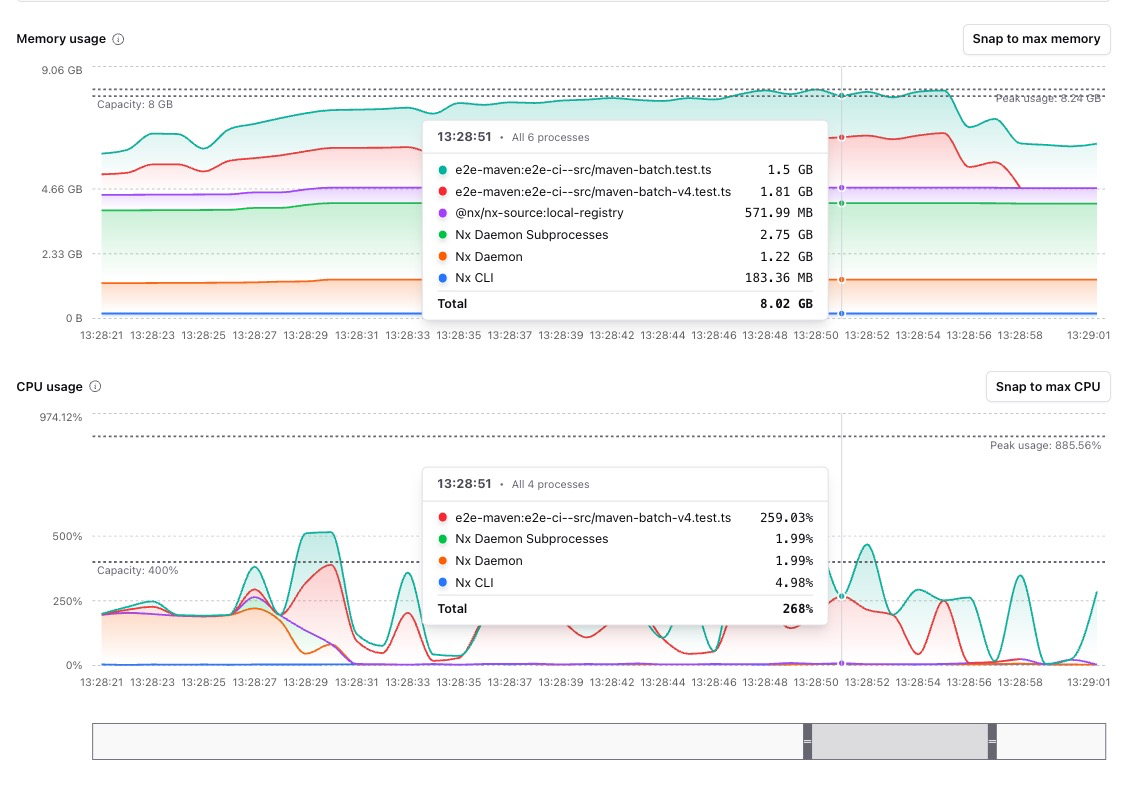
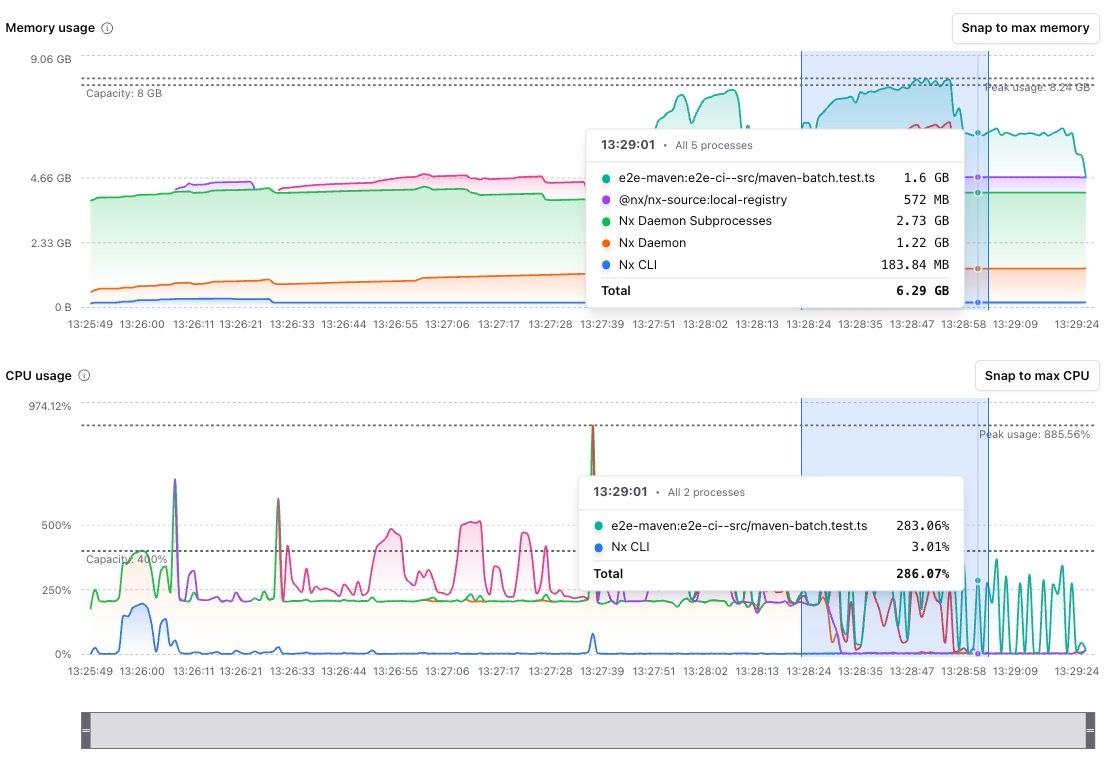
Section titled “Viewing Usage Details”Click on any agent to see a breakdown of resource usage over time. The detail view shows:
- Memory usage by process
- CPU usage by process
- Resource consumption for each task
- Nx CLI overhead
This view helps you find exactly which task is using the most resources, not just that "something" in your pipeline is the problem.
Using the Detail View
Section titled “Using the Detail View”The detail view has a few features to help you dig into resource usage:
Legend: Click items in the legend to focus on specific tasks or processes
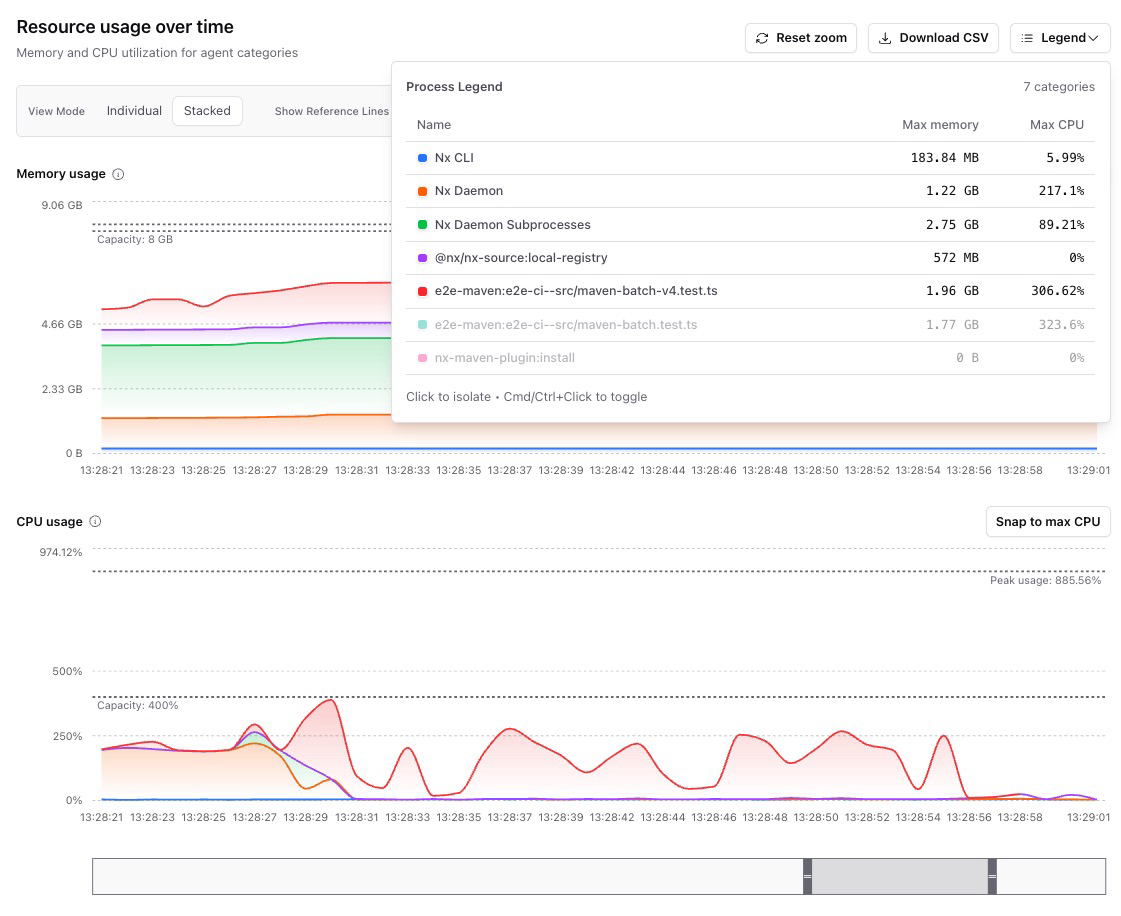
Timeline scrubber: Use the scrubber at the bottom to jump to specific points in time or zoom in on peak usage
View modes: Switch between "stacked" view (total usage at any time) and "individual" view (each process separately)

CSV export: Download the raw data if you need to dig into sub-process details
Common Use Cases
Section titled “Common Use Cases”- Finding memory-hungry tasks: Figure out which project eats the most memory when running tasks in parallel. You can then run just that project with lower parallelism instead of slowing down everything.
- Spotting misconfigured tooling: See when a bundler or build tool is pulling in more files than it should.
- Debugging E2E bottlenecks: Find out if the slow part is the tests themselves or something in the dependency chain.
- Comparing before and after upgrades: Check if a dependency upgrade caused a spike in resource usage.
- Detecting memory leaks: Look for tasks where memory keeps climbing over time.
- Picking the right resource class: Figure out the right agent size when moving to Nx Agents from GitHub Actions or other CI providers.
Manual Metrics Upload
Section titled “Manual Metrics Upload”If you're running your own CI runners instead of Nx Agents, you can still collect resource metrics and upload them to Nx Cloud.
How It Works
Section titled “How It Works”Nx writes resource metrics to a local directory during task execution. To view this data in Nx Cloud:
- Save the metrics directory as a CI artifact
- Download the artifact after the run finishes
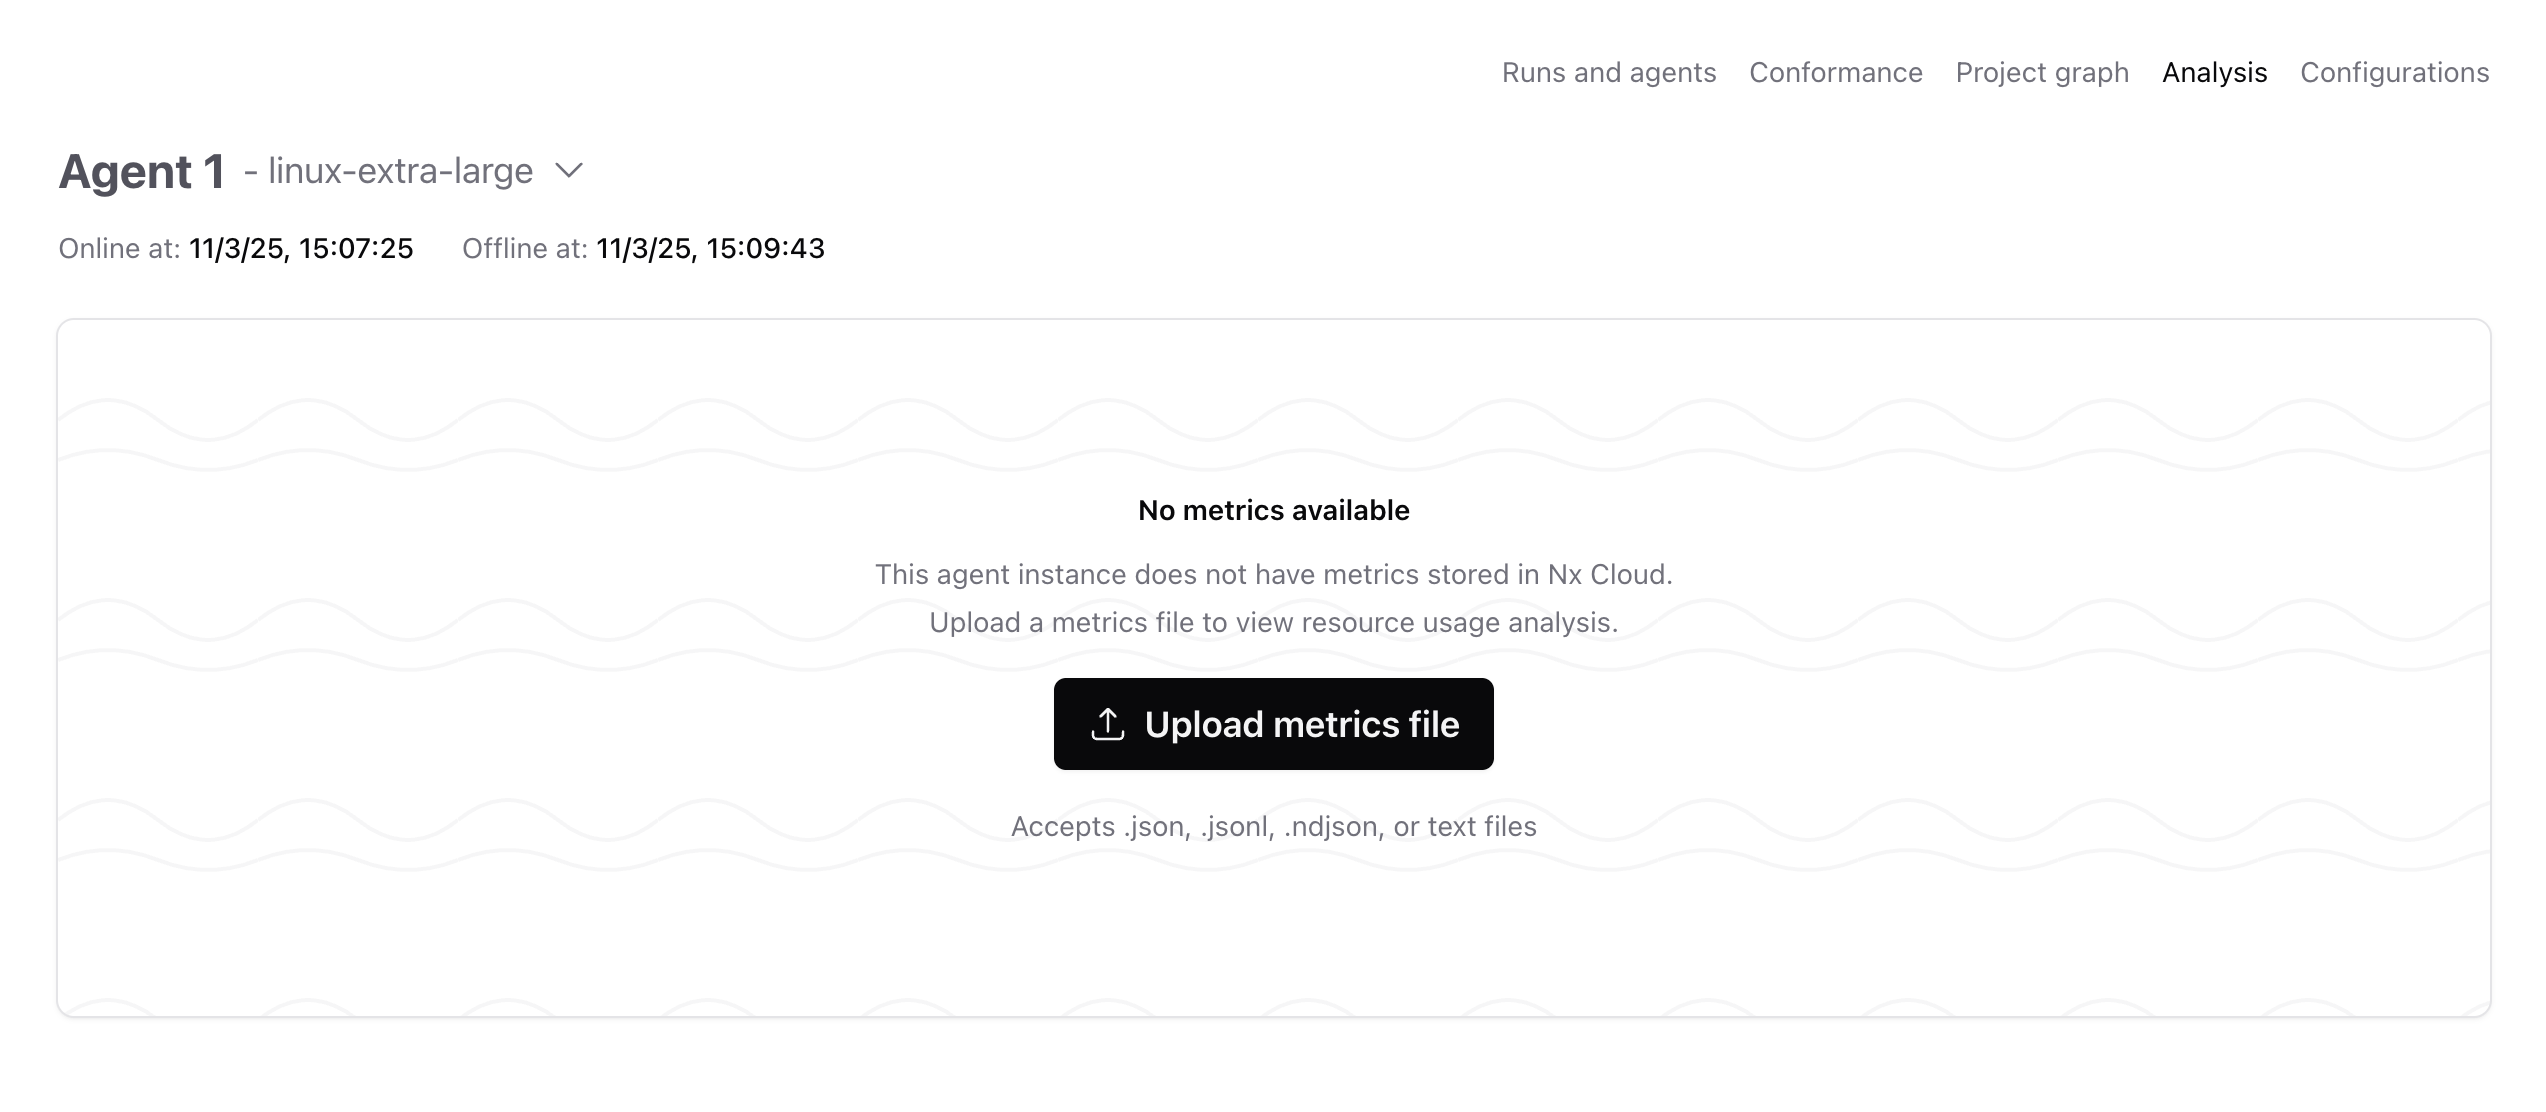
- Upload the metrics file in the Nx Cloud analysis screen
Configuration
Section titled “Configuration”Metrics collection is currently opt-in. To enable it, set the NX_CLOUD_ENABLE_METRICS_COLLECTION environment variable:
export NX_CLOUD_ENABLE_METRICS_COLLECTION=trueIn future Nx versions, metrics collection will be enabled by default. You can use this same variable to disable it if needed.
Set the NX_CLOUD_METRICS_DIRECTORY environment variable to a directory for the metrics to be written in e.g. .nx/cache/metrics.
export NX_CLOUD_METRICS_DIRECTORY=/path/to/metricsSaving Metrics as CI Artifacts
Section titled “Saving Metrics as CI Artifacts”Set up your CI to save the metrics directory as an artifact so you can download it later.
jobs: build: runs-on: ubuntu-latest env: NX_CLOUD_ENABLE_METRICS_COLLECTION: true NX_CLOUD_METRICS_DIRECTORY: ${{ github.workspace }}/.nx/cache/metrics steps: - uses: actions/checkout@v4 - uses: actions/setup-node@v4 - run: npm ci - run: npx nx affected -t build test lint - name: Upload metrics artifact if: always() uses: actions/upload-artifact@v4 with: name: nx-metrics path: ${{ github.workspace }}/.nx/cache/metricsbuild: variables: NX_CLOUD_ENABLE_METRICS_COLLECTION: 'true' NX_CLOUD_METRICS_DIRECTORY: $CI_PROJECT_DIR/.nx/cache/metrics script: - npm ci - npx nx affected -t build test lint artifacts: paths: - .nx/cache/metrics when: alwaysjobs: build: docker: - image: cimg/node:lts environment: NX_CLOUD_ENABLE_METRICS_COLLECTION: true NX_CLOUD_METRICS_DIRECTORY: /home/circleci/project/.nx/cache/metrics steps: - checkout - run: npm ci - run: npx nx affected -t build test lint - store_artifacts: path: .nx/cache/metrics destination: nx-metricsUploading Metrics to Nx Cloud
Section titled “Uploading Metrics to Nx Cloud”Once your CI run finishes, download the metrics artifact from your CI provider. Then go to the CI pipeline execution in Nx Cloud, open the analysis screen, and upload the metrics file.